
The FCA recently established a market activity reporter for shares and in this article I dive into the transparency data this provides.
Background
There has been a lot of angst in the press about the state of UK equity markets. So it is welcome to see the Financial Conduct Authority (FCA) start publishing transparency data on UK share trading.
The FCA states that the reason it has launched the market activity reporter for shares, is that given the wide choice of trading venues, it can be challenging to get data for the market as a whole.
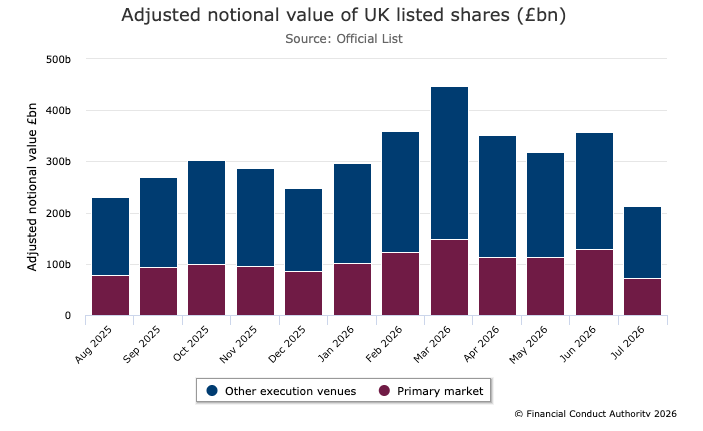
This chart from the FCA announcement illustrates this nicely.

The primary market (LSE) representing just 34% of the overall value of shares traded.
The FCA further states that the market activity reporter for shares (can I start referring to it as MARS?) is an interim solution to the equity consolidated tape (CT) that is expected to start operating in 2027 or early 2028.
Let’s take a look at what MARS provides. (Hmm, perhaps not the best abbreviation).
MARS Data
The MARS homepage takes you directly to a search page allowing simple criteria to be selected.
So entering Instrument Name as “HSBC”, Trading Date range for the past week and Currency as “GBP”, I get:

Showing both Total Market Activity and Adjusted Market Activity, with the methodology document stating that the later filters out non-price forming transactions and transactions not contributing to the price discovery process.
So Adjusted Market Activity is of more interest and we see:
- the number of trades each day,
- volume of shares traded
- value of shares traded in GBP
For HSBC on:
- 3rd August, there were 52,810 trades for 37.4 million shares at a value of £596 million.
- 29th July, there were 67,265 trades for 55.3 million shares at a value of £863 million.
(As of writing this blog, yesterday’s data is not available as the FCA publishes by 2pm on a T+1 basis)
Visualisation
There is also a Visualisation tab, where for a selected ISIN, we can get the same data for a 1-year historical period. Let’s do that for the ISIN GB0005405286 for HSBC and show the first 2 charts.

Showing clearly how volumes fluctuates massively in financial markets.
For HSBC:
- Peak number of trades (adjusted) was 118,040 on 8 April 2026
- The next highest was 102,470 on 5 May 2026
- The lowest excluding Xmas week, was 16,800 on 5 December 2025
- The peak number 7X the lowest
- Peak adjusted liquidity was £1.56 billion on 19 Jun 2026
- The next highest was £1.31 billion on 19 December 2025
A lot of interesting data indeed.
And you can repeat for your favourite holding.

A lot of trading in BP from late March 2026 onwards, hardly surprising given the volatility in Oil prices, but interesting to see the peaks in late May.
That’s All
That’s all I have time for today.
The FCA MARS tool is easy to use.
Providing a lot of volume data on shares.
To download or Visualise on the site.
A great interim offering until the Consolidated Tape starts in 2027/2028.
I encourage you to give it a try.
Leave a Reply