
LLM’s are very useful in research and analysis. In this blog I conclude my first 3 posts on analysing DTCC CPMI-IOSCO QD documents, by summarising the success, failures and lessons learned.
Background
Large Language Models (LLMs) are very useful in summarising and analysing data in documents. By using LLMs, we can improve our own productivity. Following on from my prior three blogs:
- Using an LLM with Public CPMI-IOSCO Quantitative Disclosures for CCPs, in which I used Anthropic Claude
- Trying another LLM with Public CPMI-IOSCO Quantitative Disclosures for CCPs, in which I used Google NotebookLM
- Yet another LLM with Public CPMI-IOSCO Quantitative Disclosures for CCPs, in which I used OpenAI ChatGPT
In this weeks blog, I will summarise what worked, what did not and lessons learned.
CPMI-IOSCO Quantitative Disclosures (QDs)
On the Clarus Blog, I have written more than 25 articles on CCP Disclosures, one almost every quarter starting in 4Q 2016. This dataset is published quarterly by many Clearing Houses / Central Counterparties (CCPs) and contains over two hundred quantitative data fields covering margin, default resources, credit risk, collateral, liquidity risk, back-testing and more, with associated notes.
What I did in my prior blogs
In my prior 3 blogs, I uploaded pdf versions of DTCC’s Public CPMI-IOSCO Quantitative Disclosures for the recent two quarters, into each of Claude, NotebookLM and ChatGPT and made two analysis task requests of the LLMs:
- A chart of Initial Margin disclosures for each quarter for each clearing service
- A table of the top 5 disclosure references that had increased the most
The first is a simpler task and the second a more complex and time consuming one.
Let’s look at how the LLM’s did.
On the Simpler Task
This required the LLM to parse each pdf document to find the specific table (on page 12 of 25) which contained numeric values for disclosure 6.1.1.4 (which I explicitly gave) for each of GSD, MBSD & NCC and use this data as the source of a stacked bar chart.
How did each LLM perform?
Well, they all presented the correct data, great.
- Claude did the best as it gave me what I expected, a chart with two bars, one for each quarter, stacked results for each clearing service and hovering over the chart brought up a table showing the numbers (see my earlier blog).
- ChatGPT also did well, but it chose to return a clustered bar chart, showing each clearing service separately with two sequential bars showing the quarters (see blog), not bad but not what I had in mind
- NoteBookLM does not output charts, but gave me a table of the correct results
If I had to do this task manually, it would simply have involved reading each pdf in order to find the values of reference 6.1.1.4, copying and entering these into Excel and creating an Excel Chart. A task that would have taken me a few minutes at best.
Were the LLMs better and quicker?
I would say so, at least both Claude and ChatGPT, gave me nice charts with good numbers and probably save me a minute or two of work.
But to be confident that the numbers were correct, I did open the document and check the numbers in the charts with the source documents, so foregoing some of the time saving.
On the Complex Task
This required the LLM to:
- Parse each 25 page pdf with 35+ tables and collect values for 150 distinct disclosures references (indexed by numeric codes n.n.<n>.<n>) for one of the clearing services GSD.
- Discard the references with non-numeric values and for all the numeric ones calculate a percentage increase from 2Q 2024 to 3Q 2024 and sort by largest increase
- Return a table of the top 5 results, with enough columns to be useful, so reference number, description of the disclosure, values for each quarter and the percentage increase.
How did each LLM perform?
To check that, I had to manually do the same exercise.
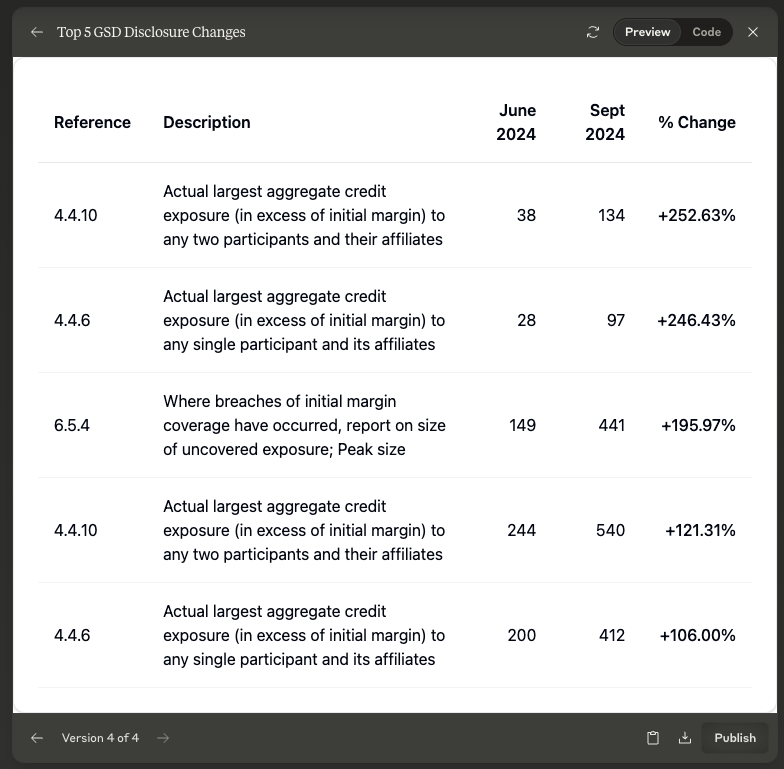
To get the following correct table:

Unfortunately each of the LLMs failed this task badly.
Worse than that they all presented results that were just wrong!
And despite further prompts to ask them to check the results as not correct, each still continued to return bad results.
- Claude found 4.4.6.1 as its largest increased disclosure with 106%, but it missed entirely the four higher ones in the table above, instead reporting ones with 59%, 55%, 32% and 25%, which are much lower down the increases table.
- NoteBookLM, found 6.5.4 with 196% as it’s largest increase, so it missed the 253% and 246% increases above and it’s next highest were 55%, 31%, 25% and 17%, again much lower down the correct result set.
- ChatGPT found 59% as it’s highest, so missed nine disclosures higher than this!
For an un-suspecting user, who simply took their output, the error would have been catastrophic. Ok, I exaggerate, perhaps not catastrophic, but certainly erroneous and at best very embarrassing, if picked up by a subsequent reader and requiring re-statement.
What Went Wrong
My conjecture in the prior blogs was that while the DTCC pdf documents are formatted to be human readable, (so I can visually identify any and all values for each disclosure reference and clearing service), they are not reliably machine readable.
And the LLMs confidently took the pdfs, read the data in an in-complete erroneous fashion and proceeded to do the analysis on partial results. Each LLM failing in different ways on the parsing of the source tables.
How can we prove this?
Well I need the same data in a machine readable CSV format, which with some effort (manual copy & paste or bespoke coding) can be done from either source pdfs or excel workbooks.
And then I can simply upload this to each LLM and ask the same question.
So let’s do that and show the results from each LLM.
Claude

Great, the correct results!
The only issue I had was that the first version of this table had the correct data in the 3 right hand columns but the Reference and Description columns were bad or empty. It took a further 3 prompts to get the corrected version 4 of the table shown above.
ChatGPT

Great, the correct results again.
This time I just need a couple of minor formatting prompts to not show the percentage increase to 12 decimal places but I again failed to remove the mysterious column with 46, 40, 60, …despite a few attempts.
What Went Wrong – Proved
Given that both these LLMs gave the correct results from the machine readable CSV, my conjecture on the cause of the bad results was correct.
It is due to a failure to correctly parse/read the table data from the pdfs.
Unfortunately this is a silent failure and the subsequent steps proceeded, returning results that to the unsuspecting user look correct.
A worse error than catastrophic failure (no results) or results that obviously look wrong.
Time Saving for Complex Tasks
Had the LLMs been able to work correctly with the pdfs, I would have saved hours of time in getting results.
A very desirable productivity gain.
The alternative of using DTCC’s Excel workbook, was only supported by ChatGPT, but the complex nature of this with different sheets and layouts, resulted in even poorer parsing.
While creating the CSV file, required be-spoke code or a lot of manual copying and pasting, which once complete was 95% of the effort, as adding a percentage column and sorting to find the top 5 is trivial in Excel.
Learnings
My learnings from today and the three earlier blogs.
- LLMs can improve productivity, especially for simple tasks
- For complex tasks, productivity gains are more elusive
- As it is easy to fall into the fallacy that you can throw any document at an LLM and request a task to be done
- If the the task requires data analysis, we need to be confident the source data is uploaded correctly, as any mistakes in this step could result in critical and insidious errors.
- It is best to obtain or pre-process source data into a machine readable format before loading into the LLM UIs.
- And we need to get into the habit of always asking LLMs to check their results, often best done by breaking our request into simpler steps
- As well as the habit of cross checking some of the results ourselves.
- Treat LLMs as “new joiners” until we become confident on their work.
The real benefits in productivity will come for complex tasks.
Provided we take care, the gains are definitely there to be had.
As LLM capabilities and tools are continuing to improve rapidly.
Leave a Reply