
LLM’s are very useful in research and analysis. In this blog I use Anthropic Claude to analyse DTCC CPMI-IOSCO QD documents to gain an understanding of the benefits and pitfalls of using LLMs.
Background
Large Language Models (LLMs) are very useful in summarising and analysing data in documents. By using LLMs, we can improve our own productivity; so do more in less time. Who would not want that and perhaps the impact will even show up in our countries GDP statistics in a few years time!
However first we must learn how to use LLMs and to do so it is important to understand their limitations.
Starting on this journey, it is helpful to analyse documents that we have good familiarity with, as then we know what question to ask in the Chat prompt and importantly can easily check if the answer is correct.
CPMI-IOSCO Quantitative Disclosures (QDs)
On the Clarus Blog, I have written more than 25 articles on CCP Disclosures, one almost every quarter starting in 4Q 2016. This data is published quarterly by many Clearing Houses / Central Counterparties (CCPs), in either a pdf, excel or csv format.
CCPs make public over two hundred quantitative data fields covering margin, default resources, credit risk, collateral, liquidity risk, back-testing and more, with associated notes as necessary. It is this dataset that we will use.
DTCC QDs for 3Q 2024
I will take the most recent DTCC QDs for Q3 2024 and compare these to the prior quarter’s publication. These are available in either xlsx or pdf form at the DTCC website.
I downloaded the two pdfs and uploaded into Claude AI, for which I subscribe to a Professional Plan; one that currently defaults to using Claude 3.5 Sonnet LLM.
Let’s get started with Initial Margin
I like to look at the disclosures for Initial Margin first, so lets try the following prompt:
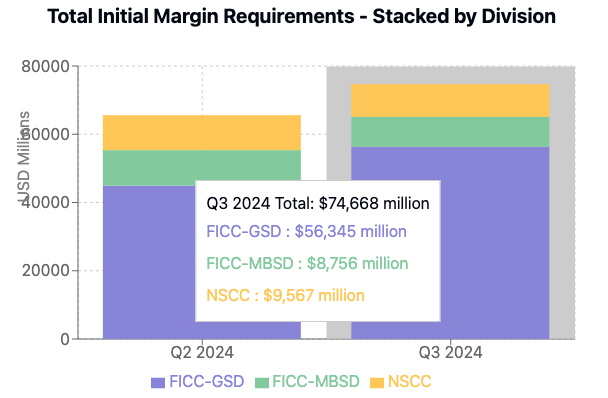
Create a stacked bar chart showing the values for disclosure reference 6.1.1.4 Total for each of GSD, MBSD and NSCC for both quarters for which their is data in the attached documents
Claude then does it’s work, culminating in it writing the code to show the chart.

Not bad at all!
And I can quickly check both source documents to make sure the numbers extracted from the pdf documents are correct; as indeed they are.
So far so good, lets try something more difficult.
What has increased the most?
For this question, after a few trials, I entered the following prompt:
In the most recent quarter find those disclosure references only for GSD that have increased the most from their value at the prior quarter end and show just the top 5 in a formatted table with rows ordered by highest percentage increase first
Which returned the table below.

- Interestingly, the first row for “Special Charge” is a supplementary disclosure without an official reference number under the title “Disclosure PRC 2 – Payment Risk Committee Disclosure 2 – Initial Margin Detail” and is data I was not familiar with at all as I had never scrolled down to page 24 of the 25 page document!
- So that by itself is an improvement to my own knowledge. The breakdown in PRC2 of IM into VAR, the main component and other components such as Liquidity is interesting data indeed.
- Now checking the values in the table one by one, the results all look correct until I get to the last row for 6.6.1 Average Total Variation Margin Paid, where while the value of $9,279 for Q2 2024 is correct, the value for Q3 2024 should be $10,283 from the source document and not $13,878, so an increase of 10.8% and not 49.6%!
- Looking at the document for Q3 2024, I can see that the table section below 6.6.1 is for 6.7.1 Maximum total variation margin paid to the CCP and this has the value of $13,878. So for some reason Claude in parsing the document has made a mistake.
- That is not good, as if we had blindly relied on the results, as would be the natural thing to do, our analysis would be flawed.
To fix this, I tried the following, to not tell Claude which row was wrong but to get it to verify it’s table, as often such follow-on prompts are known to improve the accuracy of LLMs over zero-shot prompts.
Please double check the values for each quarter and the % increase for each of these 5 rows and then re-display the table with any corrections

The result is surprising, as while the values for the last row are now correct, the table now has 6.7.1 results instead of 6.6.1 and the resulting change of 4% is correct but it surely is not the next highest.
We need another prompt…..
The first 4 rows in the table are good but replace the 5th row of results with the disclosure reference that has the next highest percentage increase after 6.8.1

One step forward, one step back.
For some reason, the first row with 460% increase is now gone! Possibly as it’s Disclosure reference is not of the form n.n.n.n?
And the description of 4.3.15.1 in the table, while correct is not meaningful without the added description of 4.3 itself. But that is not something I would expect the LLM to have worked out itself or would I?
I could of course go on with more prompts and then manually check the source data to see if these are indeed the top 5 increases.
However that will take more time, which I do not have today.
Learnings
My learnings from today.
Claude does a nice job in understanding the tables in the pdf document and extracting results to display.
However prompts to ask it to check its results are important and improve accuracy – a result that has been noted by Andrew Ng in his talk on AI agentic workflows and no doubt many others.
These prompts require some trial and error.
I would not call it prompt engineering but experience in using specific LLMs.
What’s Next
I would have liked to upload more pdf documents, so I had at least 5 quarters worth of data to analyse.
Unfortunately, when I tried this Claude returned the error message:

- But even starting a new chat with 3 pdfs, each of 1.1 Mb size, still gave the same result.
- Surprising when the upload tooltip says a maximum of 20 files of 30 Mb each.
- I guess the size of the context window is an issue here and asking Claude:

200,000 tokens sounds like it should be sufficient for 3 pdf documents of 25 pages each.
Clearly it is not, a topic to explore in a future blog.
I also intend to try similar analysis to the above with other leading LLMs, including OpenAI ChatGPT and Google Gemini.
Stay tuned for that.
I hope you found this first blog informative and enjoyable.
Leave a Reply